By Chuck Gibson
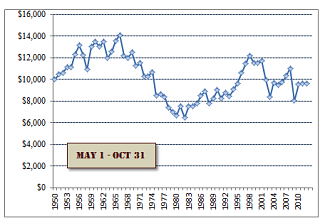
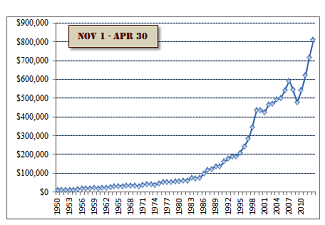
The charts below provide an historical perspective of what $10,000 invested in the SP500 would have returned since 1950 during the two periods, May-Oct and Nov-Apr.
May-Oct
[click on the image for a larger version]
Nov-Apr
[click on the image for a larger version]


