“Deflation is in our future for the first time since the Great Depression. I don’t care whose fault it is, it’s the truth.”
~ John Mellencamp
By Catherine Austin Fitts
Overview
There was just one word for financial markets in 2015 and central bankers spent all year trying not to use it–deflation.
After falling by 18 percent in 2014, the commodities CRB Index was down by another 24 percent in 2015. Gold and silver had a strong first quarter, but then continued their long consolidation down, ending the year down approximately by 11 to 12 percent.
Equity markets were flat or falling around the world. The German equity market was strong in euros, but a strong dollar translated into lower prices when converted. Chinese equity markets did not fully recover from their 3rd-quarter crash.
With junk bonds and emerging markets slammed by commodities and rising interest rates, high-quality short and intermediate U.S. and European bonds were about the only place to be in the fixed income markets.
For investors, this translated into a lot of work and risk management for little reward. In 2015, “dividends mattered.”
[This chart reflects prices adjusted for dividends; charts below may not.]
U.S. Dollar Index
The U.S. Dollar Index closed up by +9 percent. It is now up by over +21 percent since the summer of 2014. If the Fed continues to raise interest rates each quarter throughout 2016, as it indicated, this trend is likely to continue, creating pain for global dollar debtors and a headwind for U.S. exporters and consolidated corporate earnings.
Equities
Within the S&P, large and mid-caps outperformed small caps and buybacks. Concern grew regarding the dependency of company earnings and market performance on buybacks. Rising interest rates will increase the cost of financing buybacks with debt.
SCHA (U.S. Small Caps), SCHM (U.S. Mid Caps), SCHX (U.S. Large Caps), PKW (Buybacks)
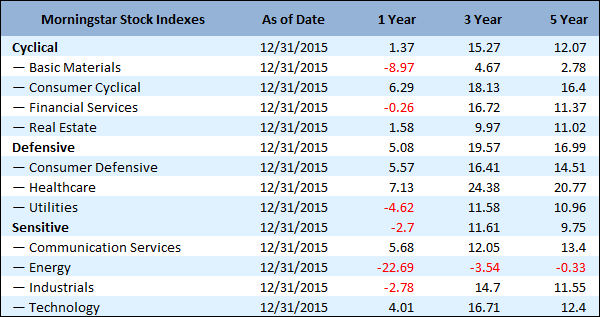
U.S. Equities: 1, 3, 5 Year Sector Performance
IBB (Biotech)
Throughout 2015, biotech continued to outperform the general U.S. market.
Obamacare ETFs: XLV(Health Care Select), IHE (U.S. Pharmaceuticals), IHF (Providers), IBB (Biotech), IHI (Medical Devices)
Obamacare continues to pump life into the U.S. health care stocks. The tech re-engineering of the U.S. health care system has far more to go by squeezing labor costs.
Motif Investing
If you are not depressed by the overall market performance, a tour of 2015 star performers at Motif Investing may do it. Investing in bear markets, war, funerals and gambling has earned excellent returns.
ITB (U.S. Home Construction)
With a U.S. presidential election coming up in November 2016, homebuilding was likely to outperform the market, and it did.
IYR (U.S. Real Estate)
U.S. real estate, however, struggled with the headwinds of rising interest rates.
OIL (Crude Oil)
The oil patch was reeling this year from a perfect storm of (1) slowing growth in China, (2) the U.S. squabble with Russia, (3) increased supply from fracking technology, and (4) U.S. oil and gas independence and the resulting OPEC response. The Oil ETN was down by 50 percent; that’s down by 72 percent in the last two years.
U.S. Coal Producers
However bad things were in the oil patch, the year 2015 was worse for the coal miners. What is happening to the market for coal is an indication of the kind of “creative destruction” occurring throughout the global economy.
As of 2011, more than one-half of U.S. coal production was attributable to the top four coal producers. Peabody Energy Corporation (BTU), Arch Coal Inc., Alpha Natural Resources, and Cloud Peak Energy (CLD) together supplied 575 million tons, or 52 percent of total U.S. coal production. Today, Alpha Natural Resources is bankrupt and the three others saw their stocks drop by 78 to 94 percent during 2015.
By comparison, renewable energy outperformed. The Guggenheim Solar ETF (TAN) was down by 9.8 percent in 2015.
RSX (Russia), OIL (Crude Oil)
Russian equities, which were down by approximately 46 percent last year, were down by no more than 1 percent in 2015 despite the continued fall in oil prices.
DAX (Germany)
The German DAX was up by +26 percent in the first half-year, but dropped back and closed up by merely 10 percent when priced in euros. Translated to dollars, the German markets were down by approximately 4 percent, making the case for hedged portfolios.
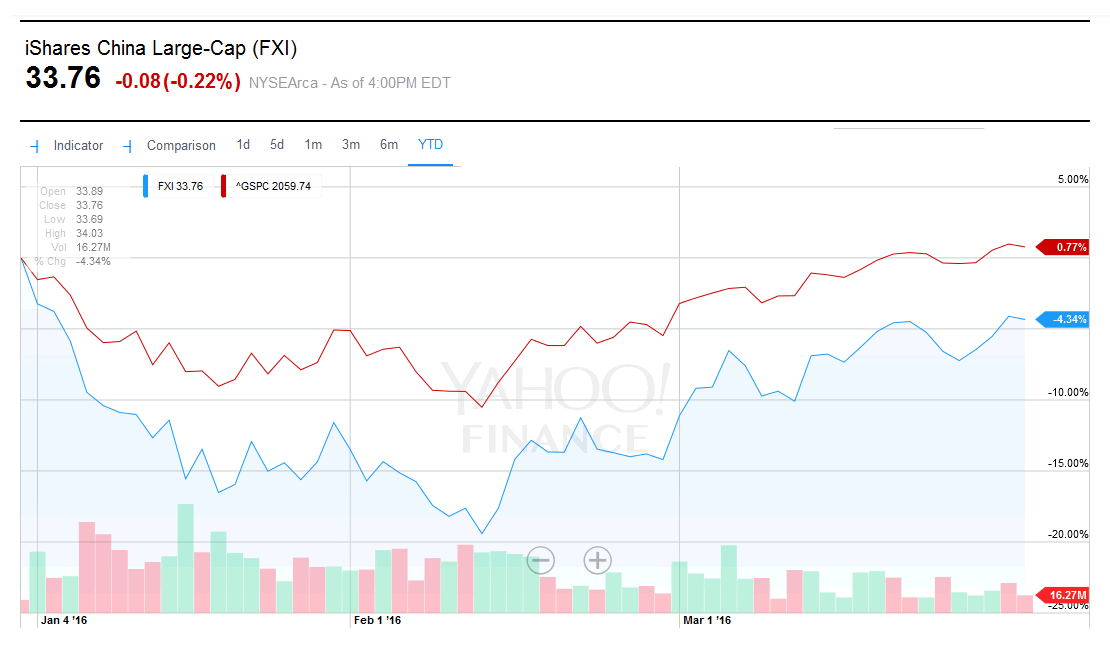
FXI (China Large Caps)
The swing of the year was the Chinese markets moving from a 30 percent increase in the first half-year, to falling by nearly -20 percent in the 3rd quarter. The growth of the Chinese equity markets–up by $7 trillion in 25 years–inspired us to take an in depth look in our 3rd Quarter Wrap-Up.
PIN (India)
India had a softer landing in the 2nd Half of 2015 than China, with the Powershares India ETF closing down 7.0 percent for the year.
EEM (Emerging Markets)
Emerging markets struggled with falling commodities prices, a slowing global economy and rising dollar and interest rates on U.S. dollar denominated debt. The iShares MSCI Emerging Markets ETF was down by 18 percent for the year.
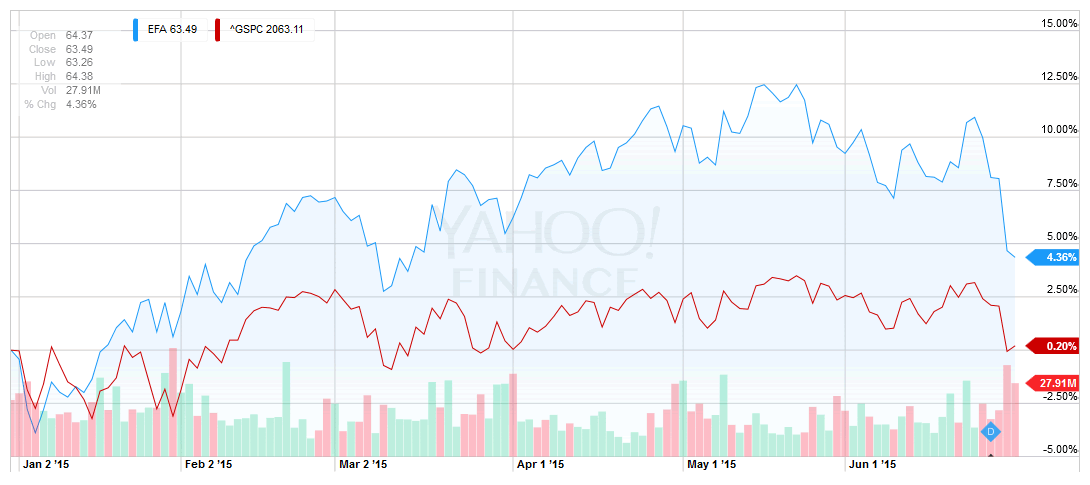
EFA (International Developed)
The developed markets were stronger outside of North America until the 4th Quarter, when they closed down by 3.5 percent for the year.
WAFMX (Frontier Markets)
Last but not least, the frontier markets continued to outperform the emerging markets.
Fixed Income
Throughout 2015, market pundits declared the end of the long-term bull market in bonds. The junk bond market fell by 12 percent and long-term Treasuries struggled for most of the year as rates rose in anticipation of a Fed rise in the 4th quarter. Nonetheless, high-quality U.S. and European short-term and intermediate bonds were one of the strongest asset categories of 2015.
AGG (Bond Aggregate), IEF (5-7yr Treasury), TLT (20yr+ Treasury), JNK (High-Yield)
Commodities
GLD (Gold), SLV (Silver)
The question before us in 2016 is whether or not gold will take the next leg down through 1100 down to 700-900 before this consolidation is over.
CRB (Commodities Index)
Read ’em and weep!
YTD Commodities Performance
Commodities(Source: Finviz.com)
Baltic Dry Index
The view of the Federal Reserve in early 2015 was that the United States was going to continue to come out of recession and help carry the global economy as China slowed. The jury is still out on whether the United States can grow in the face of the deflationary headwinds.
Let’s see what 2016 brings!


