“Markets go up and down. I really don’t worry about it very much.”
~ US Secretary of the Treasury Nicholas Brady, 1988 (personally, very wealthy)
“We’ve had Brady make several statements early on that have not given the indication that he recognizes or has the judgement to understand that he has a profound impact on the marketplace.”
~ A New York banker in 1988 (still trying to build his fortune)
The following charts are reviewed in my audio comments for the Financial Market Round Up.
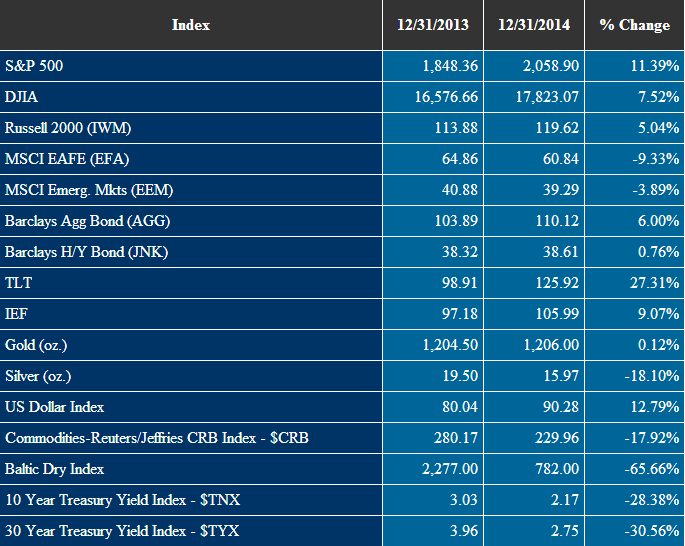
Let’s start with an overview of performance in the financial and commodities markets last year.
US Dollar Index
Solari Blog Posts
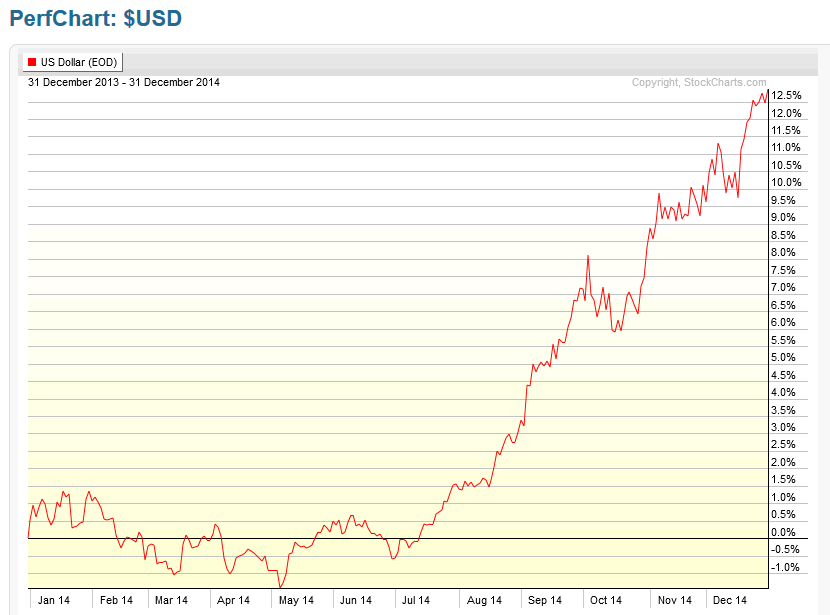
I said in September that the US Dollar Index was the indicator to watch. That turned out to be true. The rise of the dollar from late June on was relentless.
2014 Solari Report Equity Overviews
- Equity Overview Report – Jan 30
- Equity Overview – May 8
- Megatrends with Jim Puplava
- Equity Overview – July 31
- Equity Overview – The Shift to Global 3.0
Solari Report Transcript
Equities
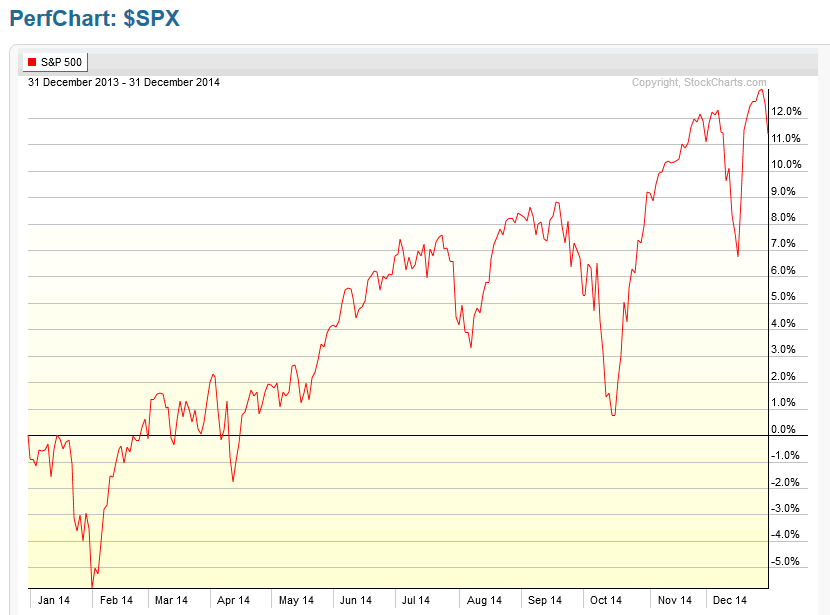
The US equity markets continued to be strong – albeit no where near as strong as 2013. The US equity market is significantly overdue for a 10-25% correction. It’s hard to believe that we did not have a deep correction in 2014.
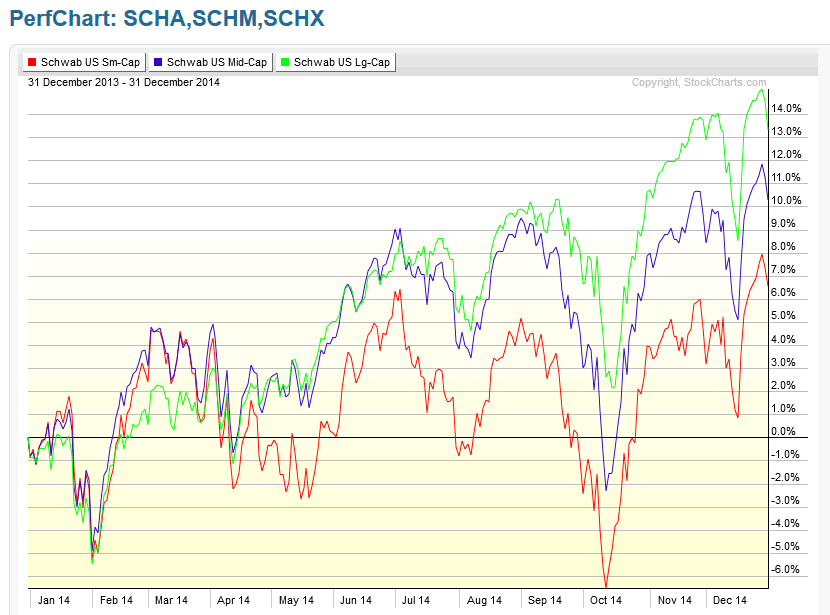
The large cap companies lead the US markets in 2014.
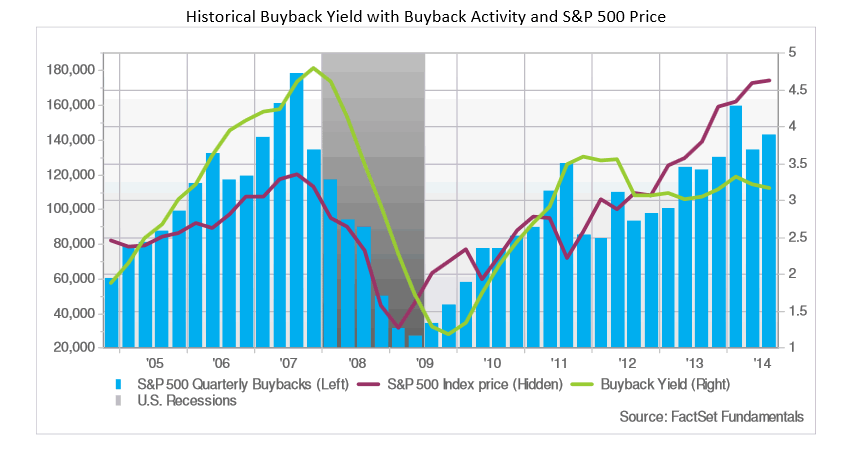
Of great concern looking ahead to 2015, is the extent to which corporate earnings have depended on financial engineering, as opposed to earnings growth. Share buybacks, including buybacks financed with debt, have contributed significantly to the earnings growth fueling US equities.
Source: FactSet Fundamentals
Source: FactSet Fundamentals
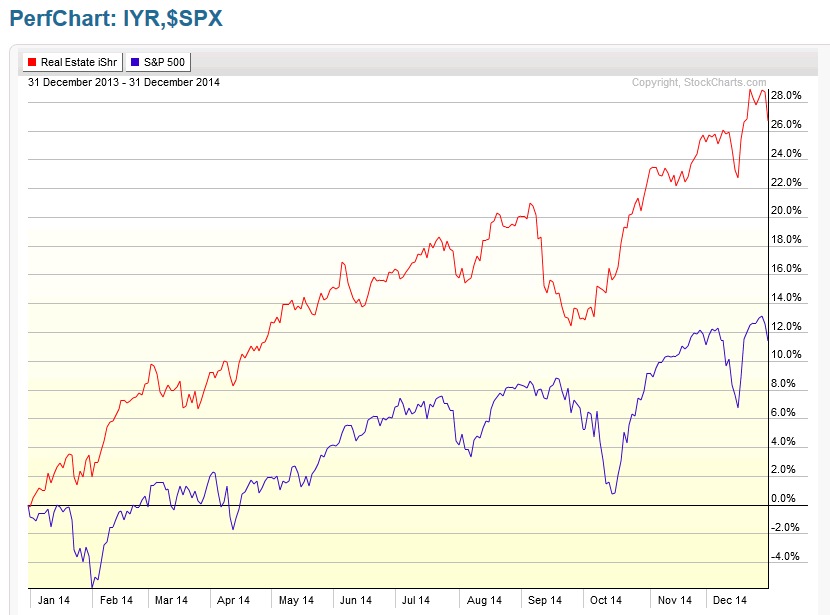
A review of Morningstar sectors show that healthcare was the strongest sector, followed by technology, utilities and real estate.
Solari Blog Post
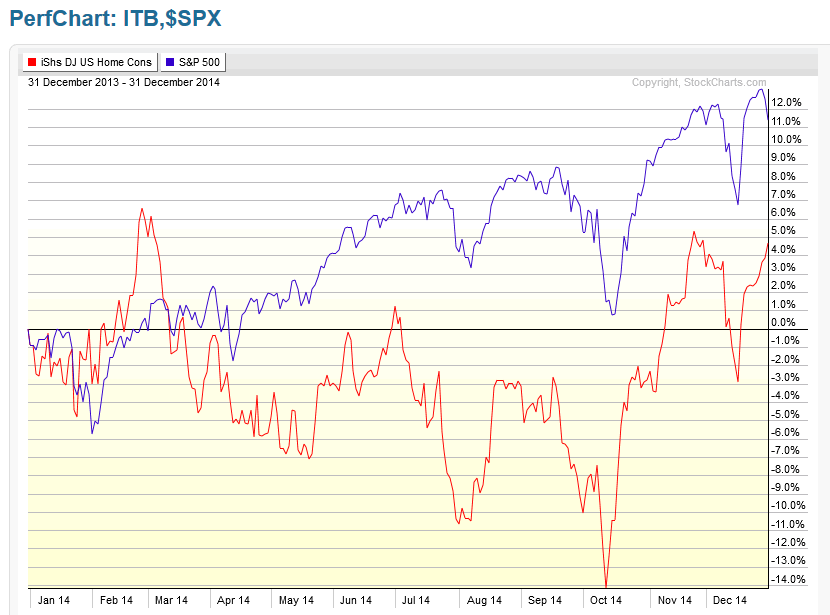
The homebuilders did not do as well as the domestic real estate REIT.
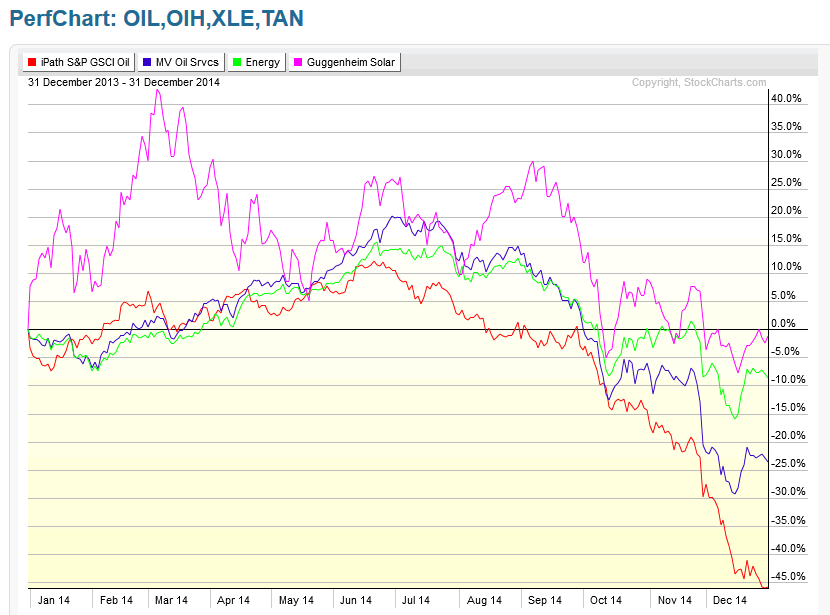
The most dramatic moves of the year resulted from Russian sanctions, the Oil Card and the subsequent drops in the stock price of oil and oil service companies as well as solar and renewables companies.
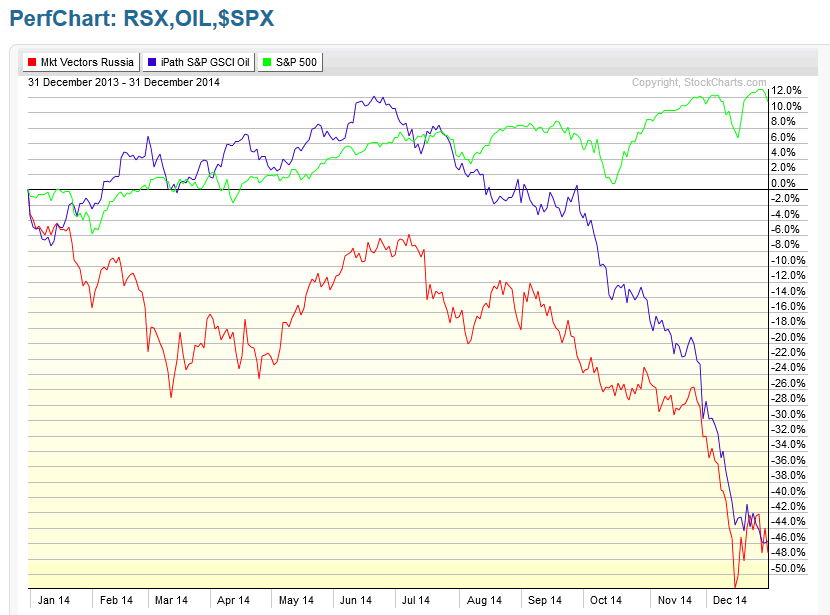
Solari Report
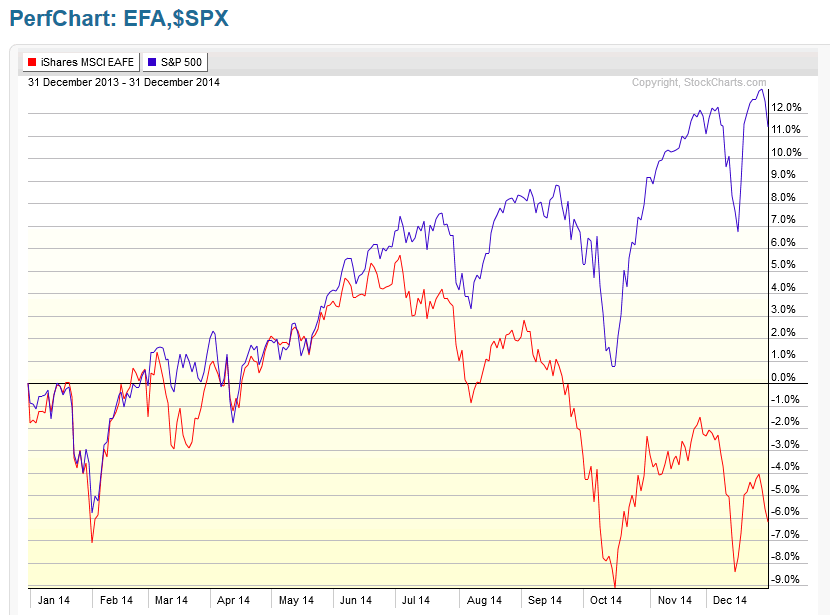
Coping with austerity and Russian sanctions, Europe struggled.
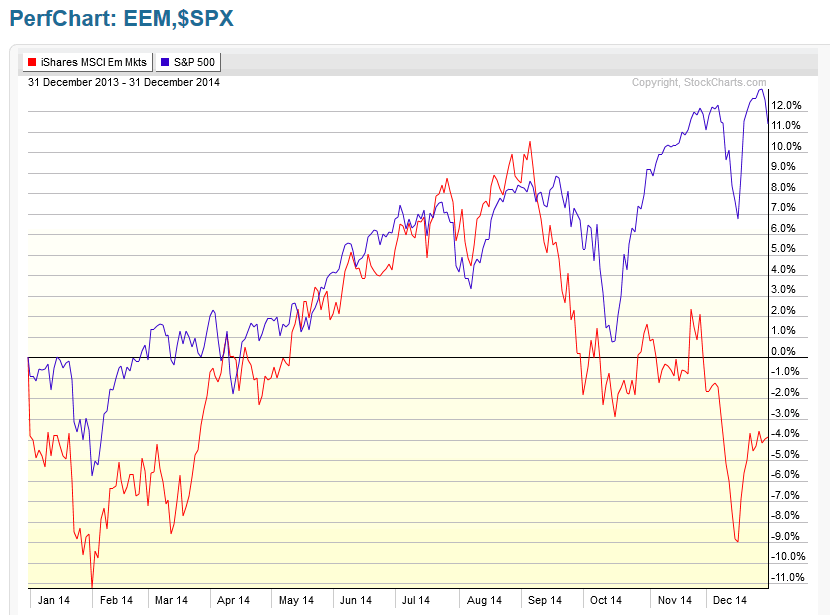
The divergence between the emerging and US markets started to close and then reversed, with the emerging markets closing down for the year.
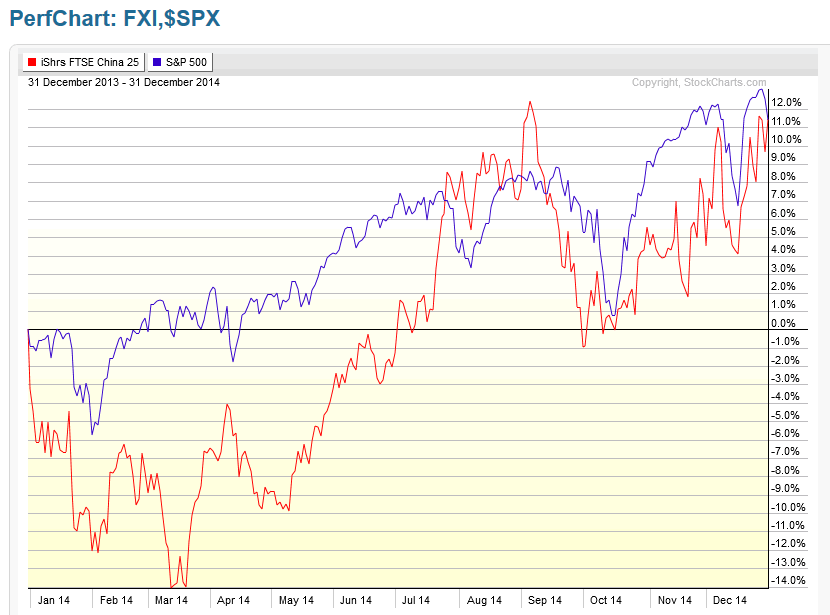
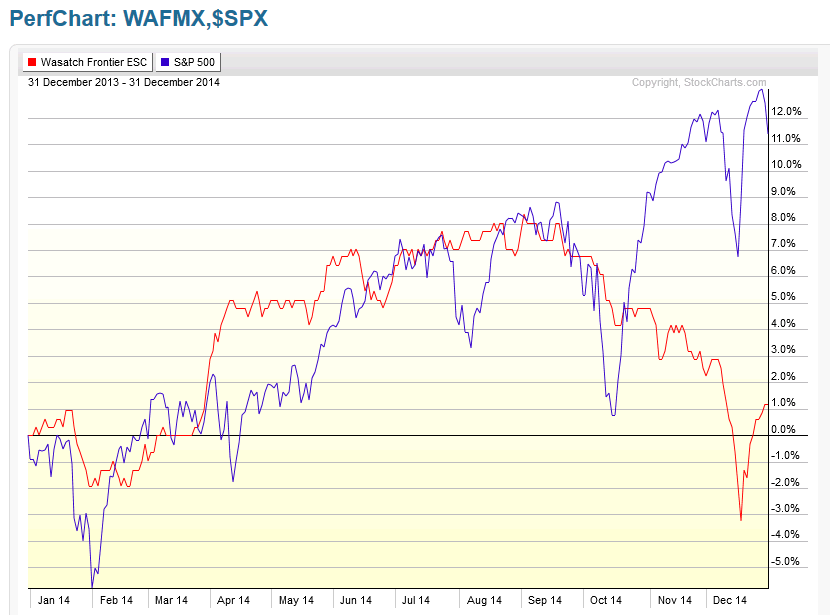
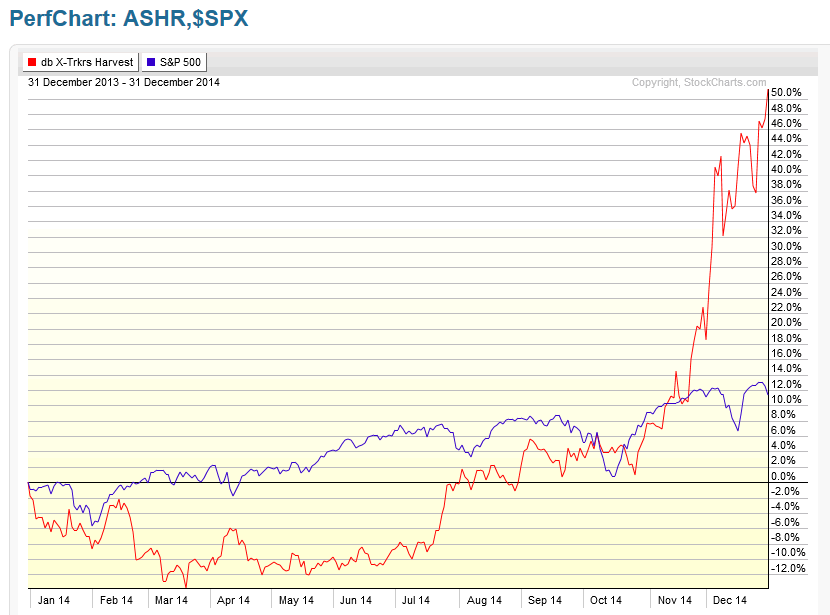
There were, of course, exceptions with Indian markets trading up after Modi’s election and the China markets moving up as well after regulatory changes opened up the Chinese markets to foreign investors through a linkage with Hong Kong markets in the fall. Here are two charts on the China markets this year.
Solari Report
Fixed Income
The big surprise this year came in the bond market as the long term bull in bonds kept roaring along. There was plenty of trouble with real legitimate concerns about liquidity and credit quality. Look for trouble in 2015.
Solari Blog Posts
Articles
The Fed finished tapering in 2014, but not before all of America had become central bank watchers.
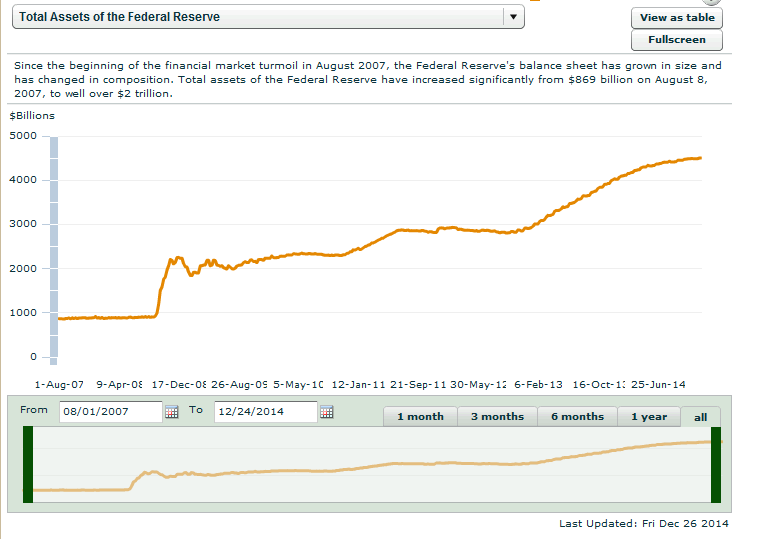

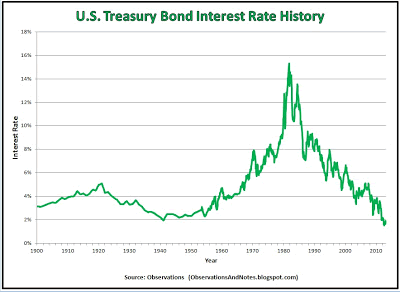
Interest rates continued to fall in the Treasury market. Can you believe it? I am still shaking my head.
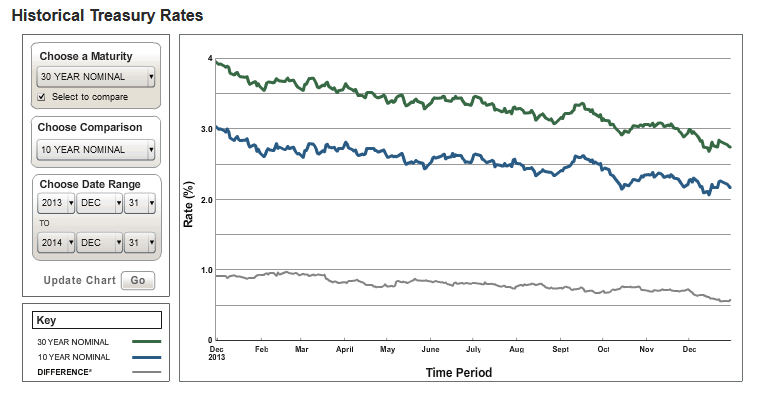
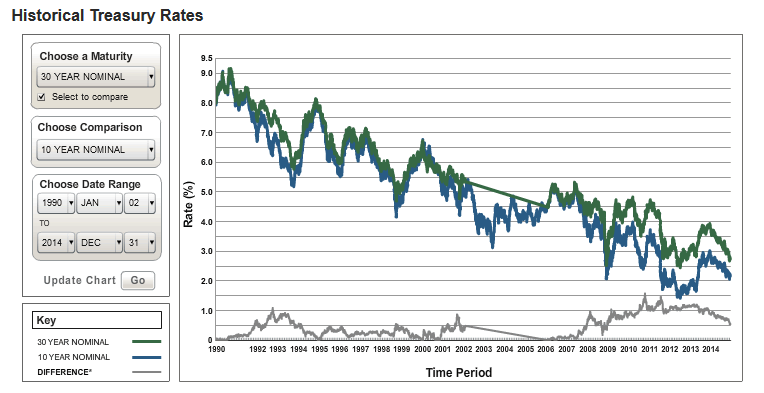
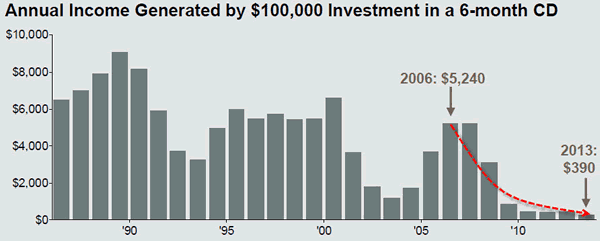
The result is that G-7 governments are financing at no cost while savers get decimated by not being able to achieve any return for their capital.
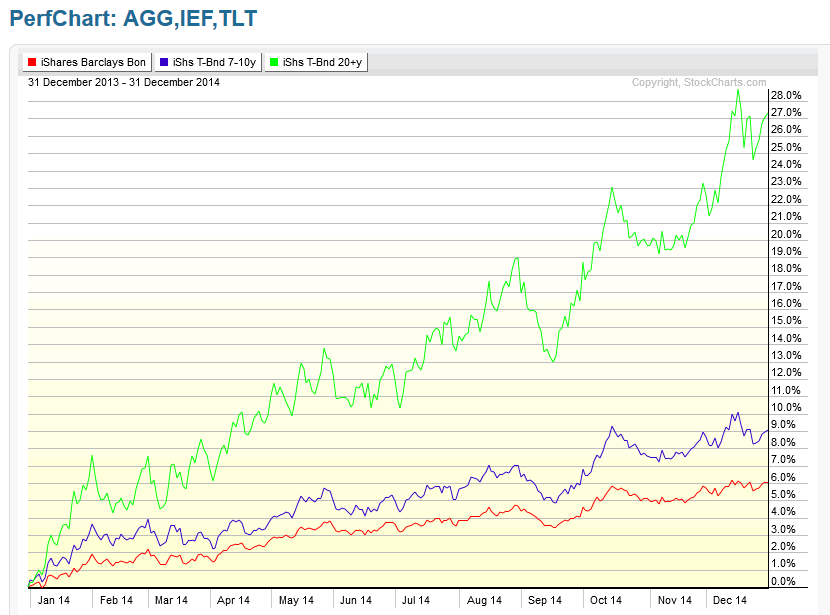
Long treasuries were the star investment category for the year with the 20 Year Treasury ETF returning 27%.
Solari Report
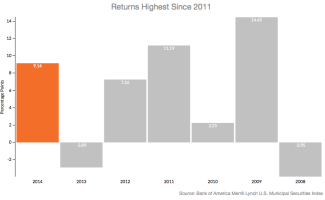
Because of legitimate concerns about credit issues and liquidity, the high-yield bond market did not do well. However, municipals had a solid year, with the best returns since 2011.
Commodities
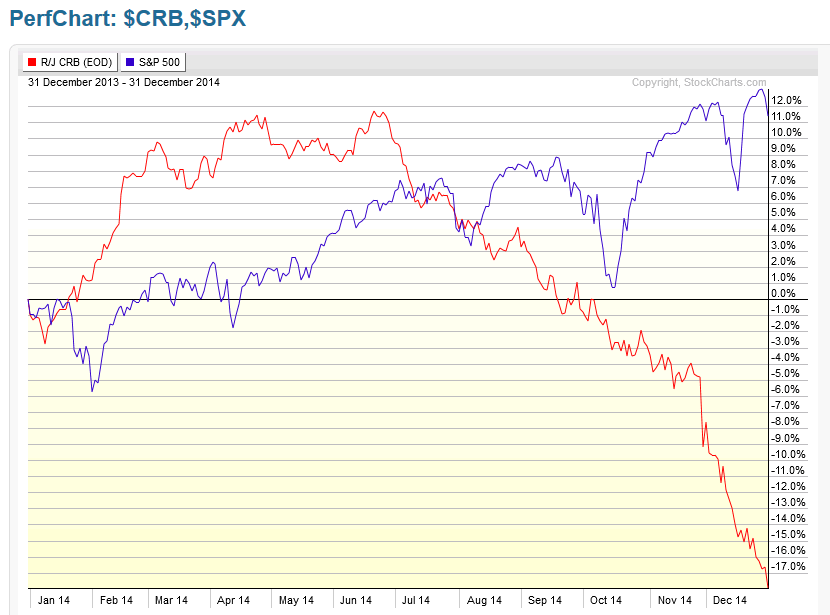
Commodities remained in the dog house, which contributed to G-7 corporate earnings and hurt the emerging markets. The drop in oil in the second half of the year was a significant contributor to drop in the CRB Index for the year.
Solari Report
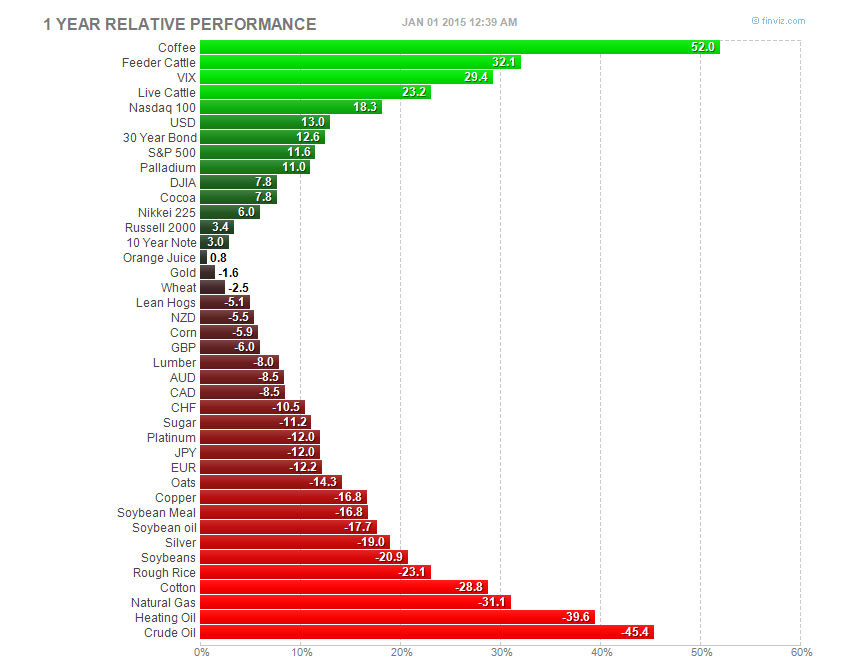
Here is a breakdown of a broad group of commodities futures markets. Coffee was up 52%. Cotton was down 28%. I live across the street from a cotton gin. Not a lot of excitement this year as there was no rush to get the cotton to market.
Global shipping slowed. <img “57936” src=”/wp-content/uploads/2015/01/baltic_dry_index.gif” alt=”baltic_dry_index” width=”972″ height=”464″ />
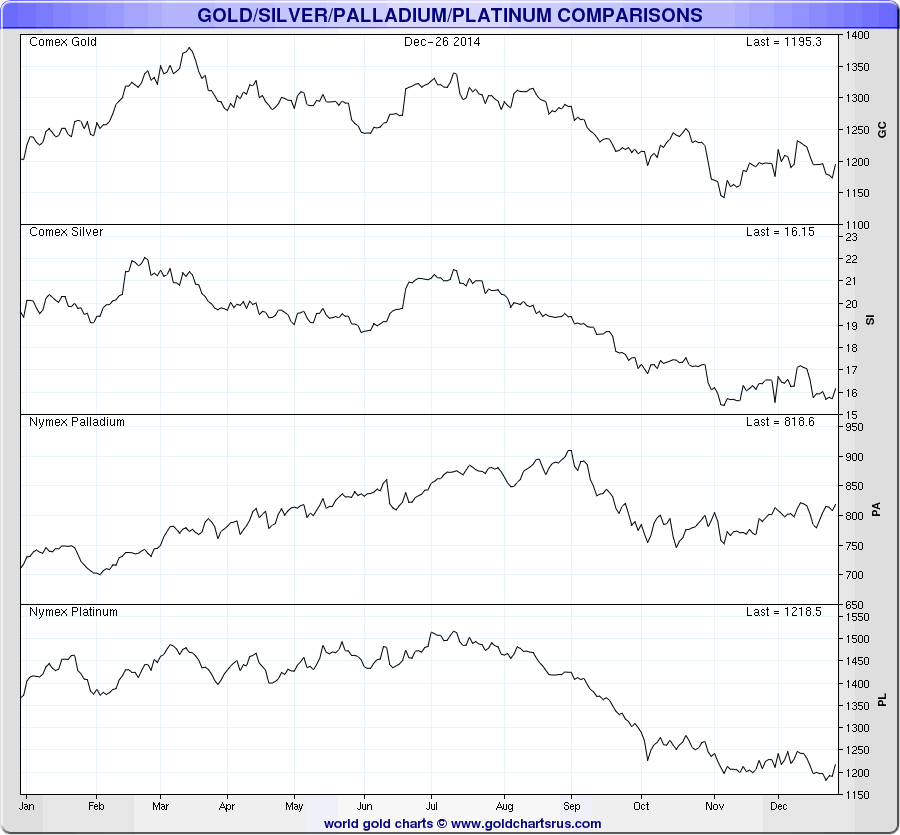
Gold perked up in the first half of the year and then closed down. Ditto for silver except its down was much deeper. <img “57934” src=”/wp-content/uploads/2015/01/GLD-SLV-SPX.gif” alt=”GLD-SLV-$SPX” width=”830″ height=”615″ />
I had said in my special precious metals report last January that gold and silver would not offer an investment opportunity in 2014. That turned out to be correct. However, the support of the $1,200 line by global physical buying was a good sign in support of a reassertion of the primary trend.
Solari Reports
- What Percentage of my Assets Should I Hold in Precious Metals?
- Precious Metals Market Report – Special Report – 2014-01-09
- Precious Metals Market Report – 2014-04-10
- Precious Metals Market Report – 2014-08-14
- Precious Metals Market Report – 2014-12-11
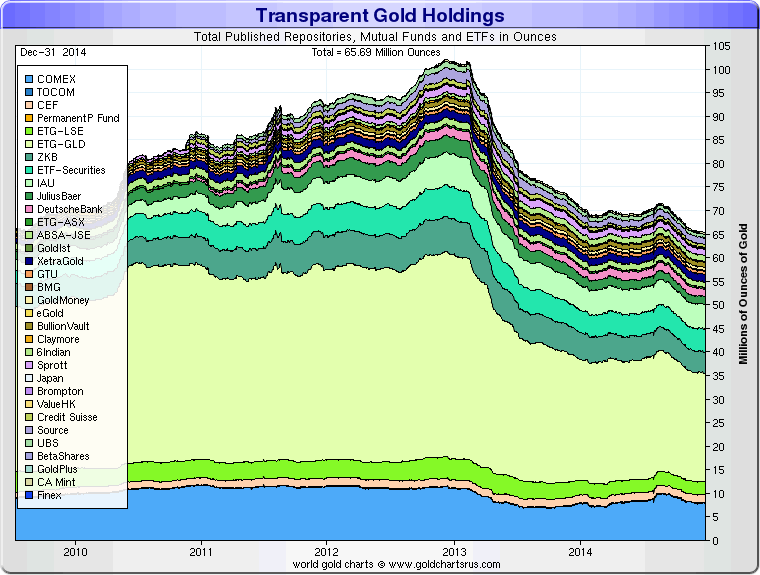
The great mystery of the last two years are the shrinking inventory of gold in GLD. Nothing illegal here, but the run up and sudden swap down with no explanation certainly feels fishy to me. Did someone do a very big trade?
Solari Report
Articles
- Chinese Spend $22 Billion to Buy U.S. Residential Property
- Realtors encouraged to learn to speak Mandarin in California and Connecticut
Solari Reports & Blog Posts
- Special Solari Report: In-State Equity Crowdfunding Offerings as an Alternative to Federal Jobs Act
- Special Solari Report: Jump Start Our Business Startups (JOBS) Act of 2012
- Crowdfunding, What It Means To You
- Coming Clean: Does Crowdfunding Ease the Way?
- Successful Kickstarter with Karen Diggs
- Crowdfunding: Growing Fresh Food Entrepreneurs
- Crowdfunding
Housing and Real Estate
The housing market is strong in areas of Global 3.0 reinvestment as well as foreign purchases. Expect more flow of foreign capital into US real estate and farmland next year.
Private Equity
Private equity was very active in 2014 and, along with mergers and acquisitions, should be in 2015. The SEC continues to decline to promulgate regulations for the JOBS Act of 2012, consequently our latest reports are on state legislation to support the use of crowdfunding to sell securities.
Scenarios for 2015
For a discussion of my scenarios for 2015 and outlook for the financial and commodities markets, see the next section, 2015: Get Ready, Get Ready, Get Ready!


